|
|
|
|
Over 20 years ago, I envisioned the future of Application Performance Management (APM). We're not quite there yet, but the recent LLM developments in AI have moved us to within sight. What I envisaged 20 years ago should become available within the next 5 years. In this article I cover where we came from in observability, where we are, where we'll go to next and how we'll get to what I envisagedPublished November 2025, Author Jack Shirazi
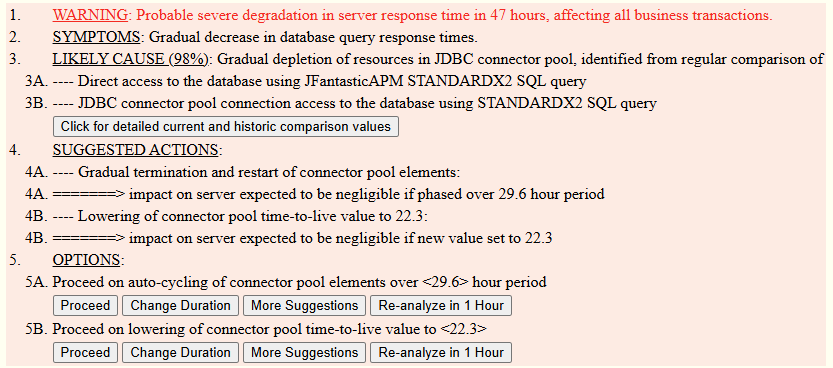
The imagined JFantasticAPM auto-managing an issue with human authorization needed to proceed, illustrating next generation auto-remediation
The tools and techniques used to achieve observability have progressed through significant transformations over the last few decades. Each generation of observability solutions has reduced the level of technical expertise required to identify and resolve issues. This article traces the evolution of observability, focusing on how each generation has lowered the barrier to entry for users, and explains what you can expect for the future of observability
The first generations, generations 0-2, extending from the 1980s until 2025
Before the first generation of observability tools were created, users detecting and analysing issues needed deep system-level knowledge. Expertise in command-line tools like ps, vmstat, and netstat was required, along with the ability to analyze server logs, application crash reports, and activity logs. Identifying and resolving issues needed in-depth OS knowledge, understanding of kernel metrics, memory management, disk I/O, and network protocols. Analysis required proficiency in shell scripting, awk, sed, and other command-line utilities for data analysis and manipulation, as well as manual correlation of many separate pieces of information from different systems to understand the root cause of problems
The first generation of observability tools, such as Nagios and Zabbix, automated infrastructure metric collection and alerting. This first generation of tools made metric data available in a centralized location, reducing the expertise and time required to create and manage scripts across systems.
These tools still required significant technical expertise. Users needed to understand monitoring concepts, define meaningful metrics, set appropriate thresholds, and configure alerts. Implementing these aspects required learning the specific configuration syntax and features of these monitoring tools. While these tools provided notifications of problems, understanding the relationships between the metrics and identifying the root cause still relied on manual analysis of data correlated across systems
Second generation APM tools like Elastic APM, Dynatrace, Datadog, were a significant shift from the first generation tools. The added features included:
These tools lowered the barrier to entry by providing a more intuitive user experience and automating some of the more complex tasks for developers and operations teams. APM tools reduced the technical burden by:
However, identifying and resolving issues even with these second generation tools still requires a depth of technical knowledge that needs significant training or experience
The current generation of observability tools, such as Elastic Observability 9, integrates AI technologies to democratize the user experience. This enables people with less specialized knowledge to gain valuable insights from the tools. This generation adds:
Third generation observability is not just second generation boosted with capabilities. It fundamentally alters who can use the solution effectively. Anyone in the organization familiar with the system being monitored can now simply ask "what changed between yesterday and today that could have caused that alert?" to start a directed investigation. Previously you could only usefully ask this question of someone whose job was monitoring, managing, or developing the system. Now your third-generation observability solution replaces the need to mentally correlate data across systems, providing answers! Instead of searching dashboards and linking traces manually, you can ask: "Why did latency spike in checkout yesterday around 2pm?" The system inspects traces, detects an upstream dependency slowdown, identifies a code deployment coinciding with the spike, and explains the causal chain in natural language.
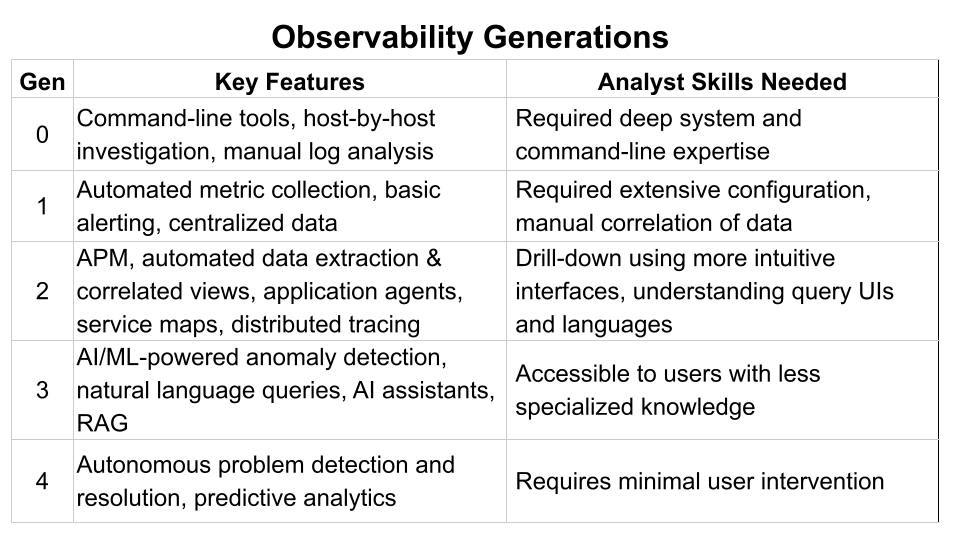
Observability generations 0 to 4
Current third generation observability solutions are still mainly reactive. They can monitor for anomalies and alert you, provide useful answers to your questions, guide you to the root cause of an issue, and even suggest actions you can carry out if you ask for suggestions. However, the AI is not yet something you would rely on to act autonomously in any role other than monitoring (e.g., they are fine for anomaly detection leading to alerts).
The next generation will be more proactive. While it's unlikely that your fourth generation system will be given general autonomy to carry out remediation actions, it will be able to execute specific types of safe actions, such as auto-rolling back a bad rollout that has lead to significant degradation in the system. It will have the capability to analyse performance trends, predict that system degradations may occur in future based on current trends, autonomously analyse the cause of the degradation, search for solutions that would remediate the trend and suggest to a human supervisor specific remedial actions which it can be authorized to proceed with. This generation will hugely reduce the time needed to be taken by people having to analyse the system and carry out actions. But safety will be built-in. Fourth-generation systems will operate within defined "safe action scopes" and require human authorization for changes that could impact customer experience, ensuring predictability and governance.
Note that at the time of writing this article, the author Jack Shirazi is employed within the Elastic Observability organization
