|
|
|
|
Kirk Pepperdine is asked to examine Javascript and AJAX performance, and looks at all the performance aspects including memory and network impact.Published August 2007, Author Kirk Pepperdine
A number of weeks ago I was asked to look into JavaScript performance. I was pretty quick to answer that everything I knew about JavaScript, let alone JavaScript performance, could be written on the head of a pin. For some reason that didn't seem to deter my client and not being one to back down from a challenge I accepted.
Now I may not have known much about JavaScript but I did have some preconceived notions. JavaScript is a bunch of short little scripts that are used to manipulate the DOM. What kind of performance problems could these short little scripts really present? Since JavaScript is used for AJAX and AJAX uses the network it seemed obvious that client server communications would be an issue. But, that is typically a server side/networking problem and not one you'd want to inflict on your poor web designer. So preconceived notions in hand I started digging.
First to familiarize myself with the landscape I took at look at the JavaScript engines that were available. I found a listing that contained 19 different engines. The bigger problem than having 19 different implementations is that the JavaScript engine specification is much weaker than the Java Virtual Machine specification. Thus 19 different implementations provides one with 19 different possible execution profiles for the SAME piece of JavaScript. Fortunately the majority of the market can be covered with InternetExplorer, Firefox, Konqueror, and Safari. That pretty much covers what most people currently use on a broad range of platforms.
Though this does limit the problem, it doesn't eliminate it. After looking at implementations I decided to troll through blog entries. I figured that people having a common problem would blog about them. What I found was pretty much what I expected to find. There were a lot of blogs that talked about how to improve network performance. There was also a smaller number of blogs that talked about execution performance (read CPU utilization). The smallest number of entries related to memory utilization. The biggest non-surprise were the large numbers of bad micro-performance benchmarks or questionable bits of performance advice.
One of the most potentially objectionable bits of advice that I ran across is something I'd not run into for quite some time in the Java world. First the advice, one should avoid using getters and setters in favor of direct access to avoid the overhead of a method call. How is this advice wrong and more importantly how could it be right? Using getters and setters in Java is universally accepted. The call is inlined very quickly so there is no method call overhead associated with it. Using getter/setters encourages better encapsulation (I've actually argued that get/set are evil but that is a different discussion). It separates those that need to know about representation from those that don't. This separation is important in that in reduces coupling and increases maintainability. The knock-on effects just go on and on and so it seems that the benefits in Java should also transfer over to JavaScript also.
The first thing to establish is if the method call overhead is really an issue. It turns out the answer to that question depends upon the engine that you are using and the amount of JavaScript you are running. Though the JavaScript implementations are pretty efficient, they generally lack the kinds of optimizations that we are used to seeing in the JVM. That is except for all implementations such as Rhino that use the JVM. Even then the optimizations come in the JVM and not in the JavaScript interpreter. If you think about how JavaScript was used, this makes sense. Why spend a huge effort tuning something when it is absolutely not needed. That was until Google and others started writing complete applications in JavaScript. Now it does make sense to avoid using get/set in favor of direct access, though this still smells like a premature optimization.
Since there is much less dynamic optimization going on in a JavaScript engine one would think that micro-benchmarking would be much easier than it is in Java. Turns out that although the problems are different, microbenchmarking JavaScript isn't so easy either. The most common cause of bad microbenchmarks is caching. The world of web lives and dies with caching. Caching is used everywhere. More over it is often very well hidden. If you are running a benchmark and you've not considered how your benchmark interacts with cache you could be in for a world of hurt if you code an application based on bad information. The first sign that a benchmark may be busted is when one proclaims that X is faster than Y when there is no obvious reason why. The obvious test is to reverse the calls and see if the observation sticks.
The most interesting observation was the lack of blogs on memory leaks and memory profiling. The blog entries were there. There just wasn't many of them and there is probably a good reason why. Browsers are up and down more often then elevators in an office building at lunch time. Every time the browser exits, away goes the memory leak. Memory leaks are really only problematic in a process that stays up for a long time. I once left Firefox up for more than 2 weeks and it was very apparent that some pages that I was visiting leaked memory very badly. I finally had to restart the browser because it stopped responding in a reasonable amount of time. While this fix is quite ok in a client, it's not so well liked for serverside work.
The big question I had was, just how can one get a memory leak from JavaScript in a browser. Turns out you have a couple of good options. First is to keep a lot of hidden elements in the DOM. Drop in a few images on a hidden nod and you've the equivalent of cache the result set from select * from very_large_table. A more interesting and hideous memory leak comes from the use of closures. Richard Cornford has an excellent explanation of the problem published at http://www.jibbering.com/faq/faq_notes/closures.html#c
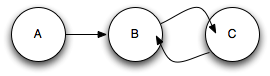
Figure 1. Cycles in an Object Graph
The final mention here are memory leaks in the engine itself, and it is one that I still don't quite understand myself. Apparently some of the JavaScript engines, most notably MicroSoft's JavaScript Engine, use reference counting for determining when memory can be freed. With reference counting, the referent object increments a counter in the referred. If the count goes to 0, then you can free memory held by the object. Now lets say we have object A create object B and B creates C. Now lets say that B and C point to each other as depicted in figure 1. Next we release object A's hold on B. By releasing the hold on B we make both it and C recoverable. However B and C's counts are not 0. Consequently B and C are not collectable under this scheme. This is a very old and very well known and understood problem with reference counting. So well known that it is quite surprising that modern browsers would still use a JavaScript engine that uses reference counting. Note that this is a simplified version of the problem that could be easily tested for. There are far more complex variations of this problem that are not so cheaply dealt with.
In preparing for all of this I had some conversations with Atilla Szegedi, a maintainer for the Rhino engine. Atilla's primary use case for Rhino is for processing JavaScript on the server. The Rhino engine is built as a straight interpreter in Java and consequently runs on the JVM. Again this is a server environment so one doesn't have the luxury of leaking. Rhino doesn't leak.
Rhino is devoid of a number of optimizations that you'd typically find in Java. The most obvious is method inlining. According to Charles Nutter (JRuby) one of the biggest optimizations that they were able to achieve in JRuby was figuring out how to in-line method calls. This is not an easy task in a dynamically typed language such as Ruby. According to Atilla, one of the biggest issues is when and how do you invalidate the inlining. It is the lack of a good solution to this problem that has most likely kept it out of JavaScript. Atilla also confirmed that given the historical use of JavaScipt it is unlikely that anyone would be willing to implement such a difficult optimization because it has simply not been needed. He points to the lack of optimizations in Rhino noting that it performs fast enough thus deflating any motivation he might have had for optimizing it. He also noted that employees from a very large search engine company have also become interested in Rhino. Given how this company stretches technology one may see some motivation for optimizing this implementation in the future.
Finally, the small number of blogs about client performance point to an issue that exists, but doesn't seem to hit that many JavaScript applications, namely that any extensive use of JavaScript tends to eat up CPU like anything. One customer we have, implemented the first version of their new client app in AJAX (Java on the server of course), and found the performance was just too slow because they were doing so much in that client app. In that case they shifted to Flex for the client app and were happy enough. This same customer has a multitude of other client apps already running in AJAX, with perfectly good enough performance, so just confirming what the blogs said - JavaScript can CPU bound the client machine if you try to do too much with it (and in those cases, performance sucks).
All in all the experience was interesting. I got to look at a couple of new tools, Firebug and YSlow (Yahoo). There wasn't any real surprises. Network calls and servers were the primary culprit of poor performance, testing clients is still a pain and our old and reliable performance tuning methodology worked.
Postscript: Thanks to George Oprica and his unnamed colleague for pointing out this Ajax View tool which is targeted at profiling javascript.
